Legend
|
|---|
Below expectations
|
Meets expectations
|
Exceeds expectations |
Overall performance
70 cases reviewed | 36 indicators across 7 themes

Text format – Overall performance
| Percentage of cases that met or exceeded expectations: 97% | 3% Below expectations | 97% Meets or exceeds expectations |
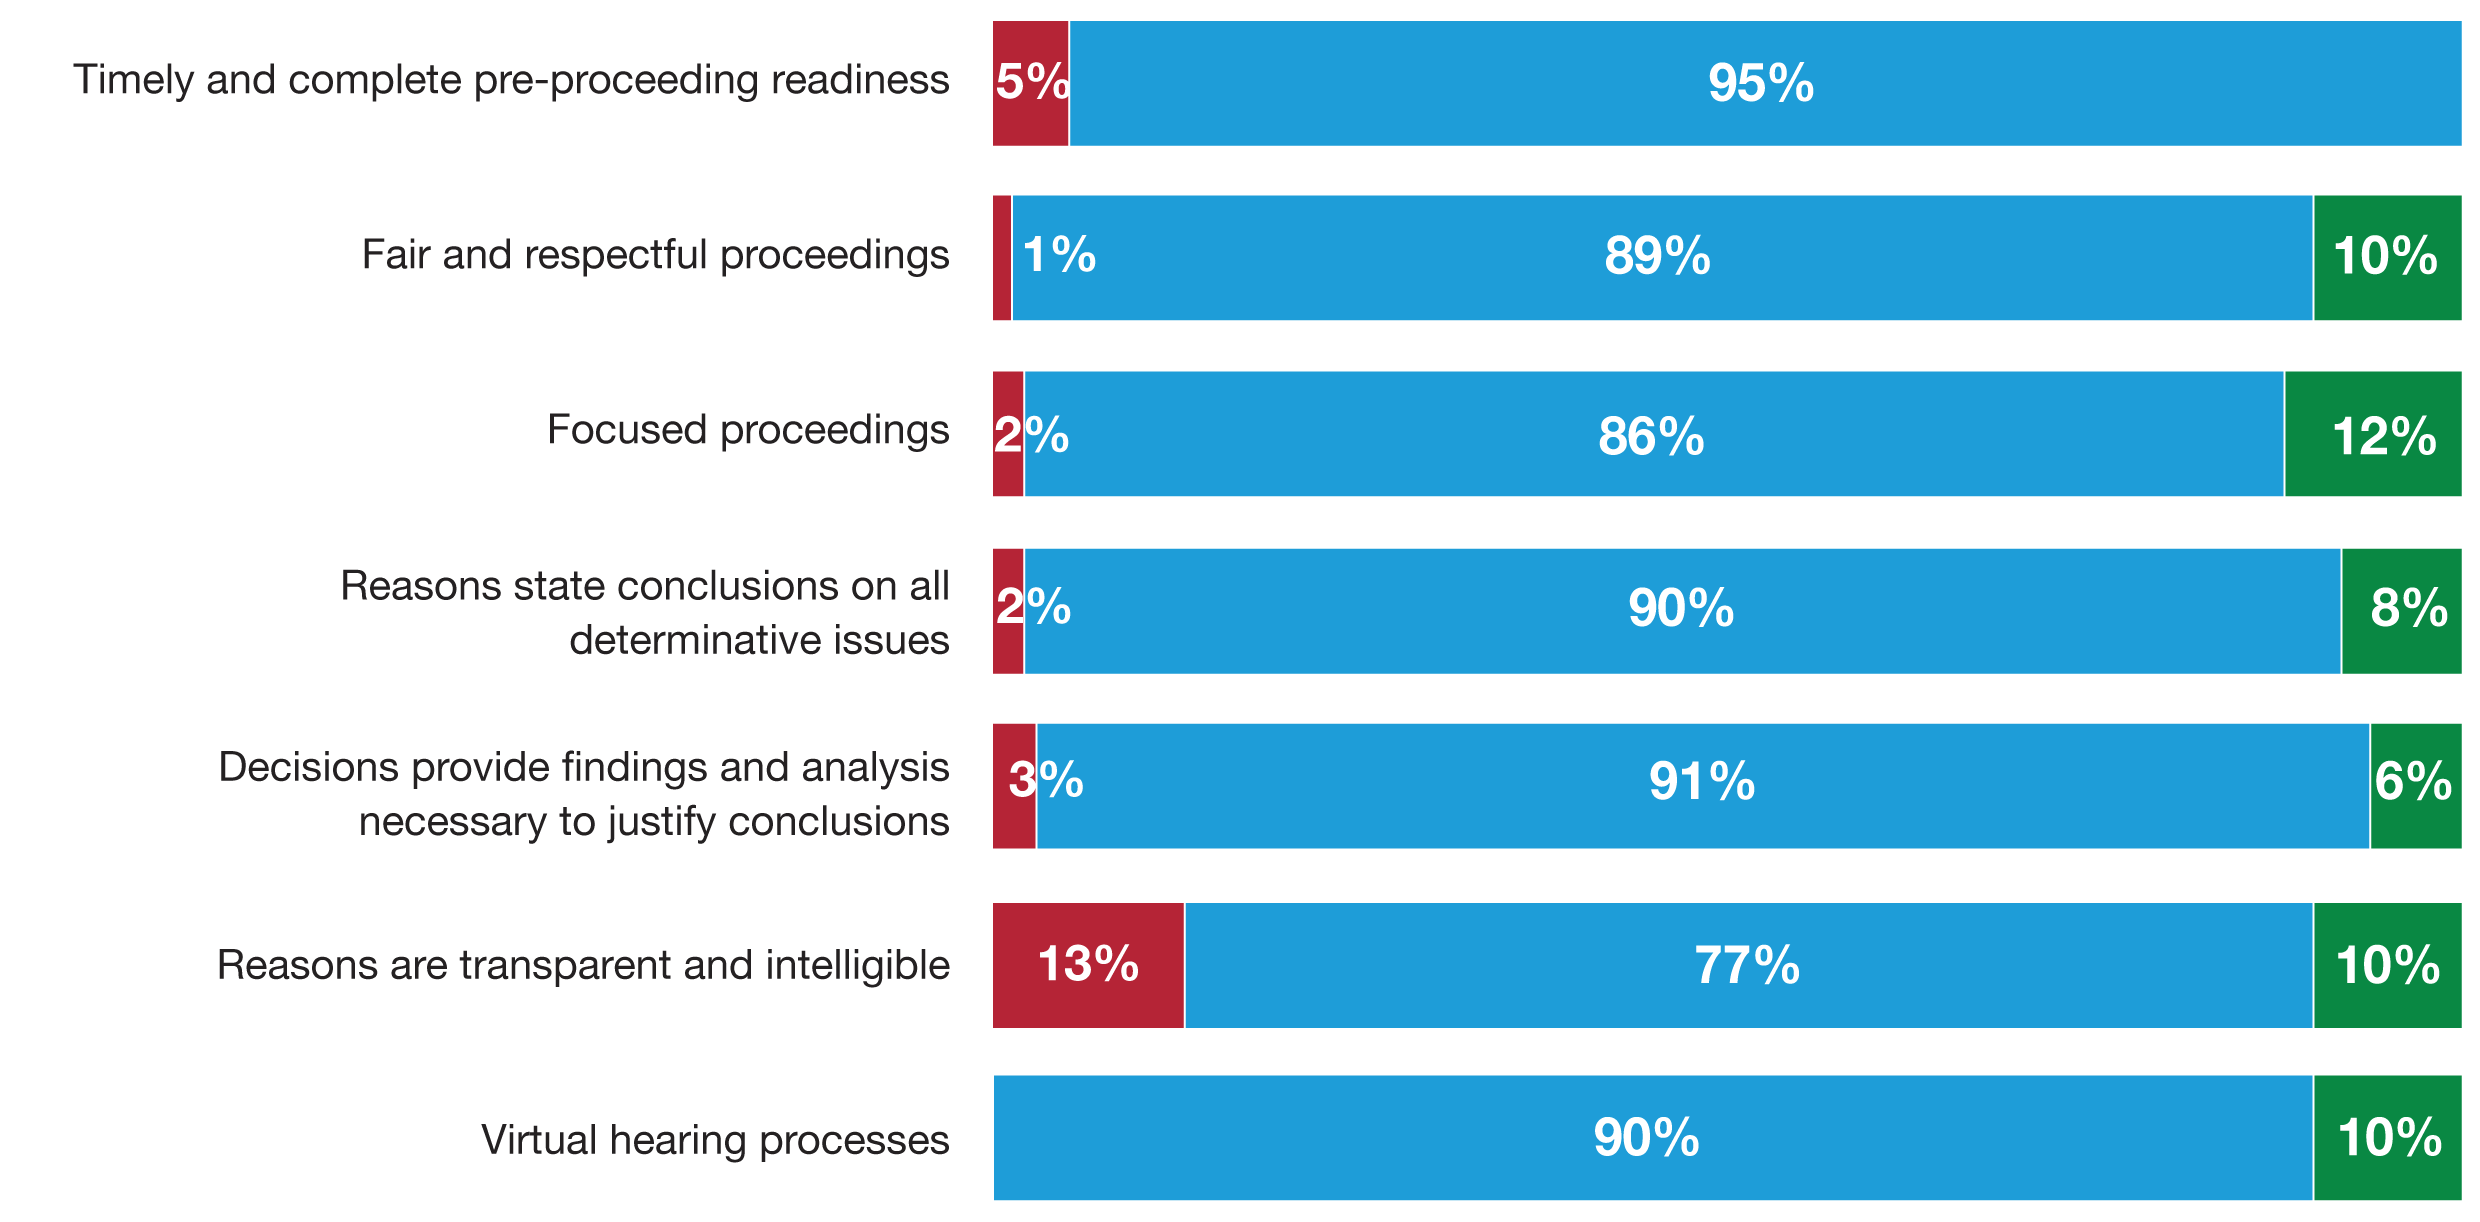
Performance by theme
Text format – Performance by theme
| Timely and complete pre-proceeding readiness | 5% Below expectations | 95% Meets expectations | 0% Exceeds expectations |
| Fair and respectful proceedings | 1% Below expectations | 89% Meets expectations | 10% Exceeds expectations |
| Focused Proceedings | 2% Below expectations | 86% Meets expectations | 12% Exceeds expectations |
| Reasons state conclusions on all determinative issues | 2% Below expectations | 90% Meets expectations | 8% Exceeds expectations |
| Decisions provide findings and analysis necessary to justify conclusions | 3% Below expectations | 91% Meets expectations | 6% Exceeds expectations |
Reasons are transparent and intelligible
| 13% Below expectations | 77% Meets expectations | 10% Exceeds expectations |
Virtual hearings processes
| 0% Below expectations | 90% Meets expectations | 10% Exceeds expectations |
Performance by region

Text format – Performance by region
Eastern region (20 hearings)
| 5% Below expectations | 90% Meets expectations | 5% Exceeds expectations |
Central region (31 hearings)
| 2% Below expectations | 89% Meets expectations | 9% Exceeds expectations |
Western region (19 hearings)
| 2% Below expectations | 86% Meets expectations | 12% Exceeds expectations |
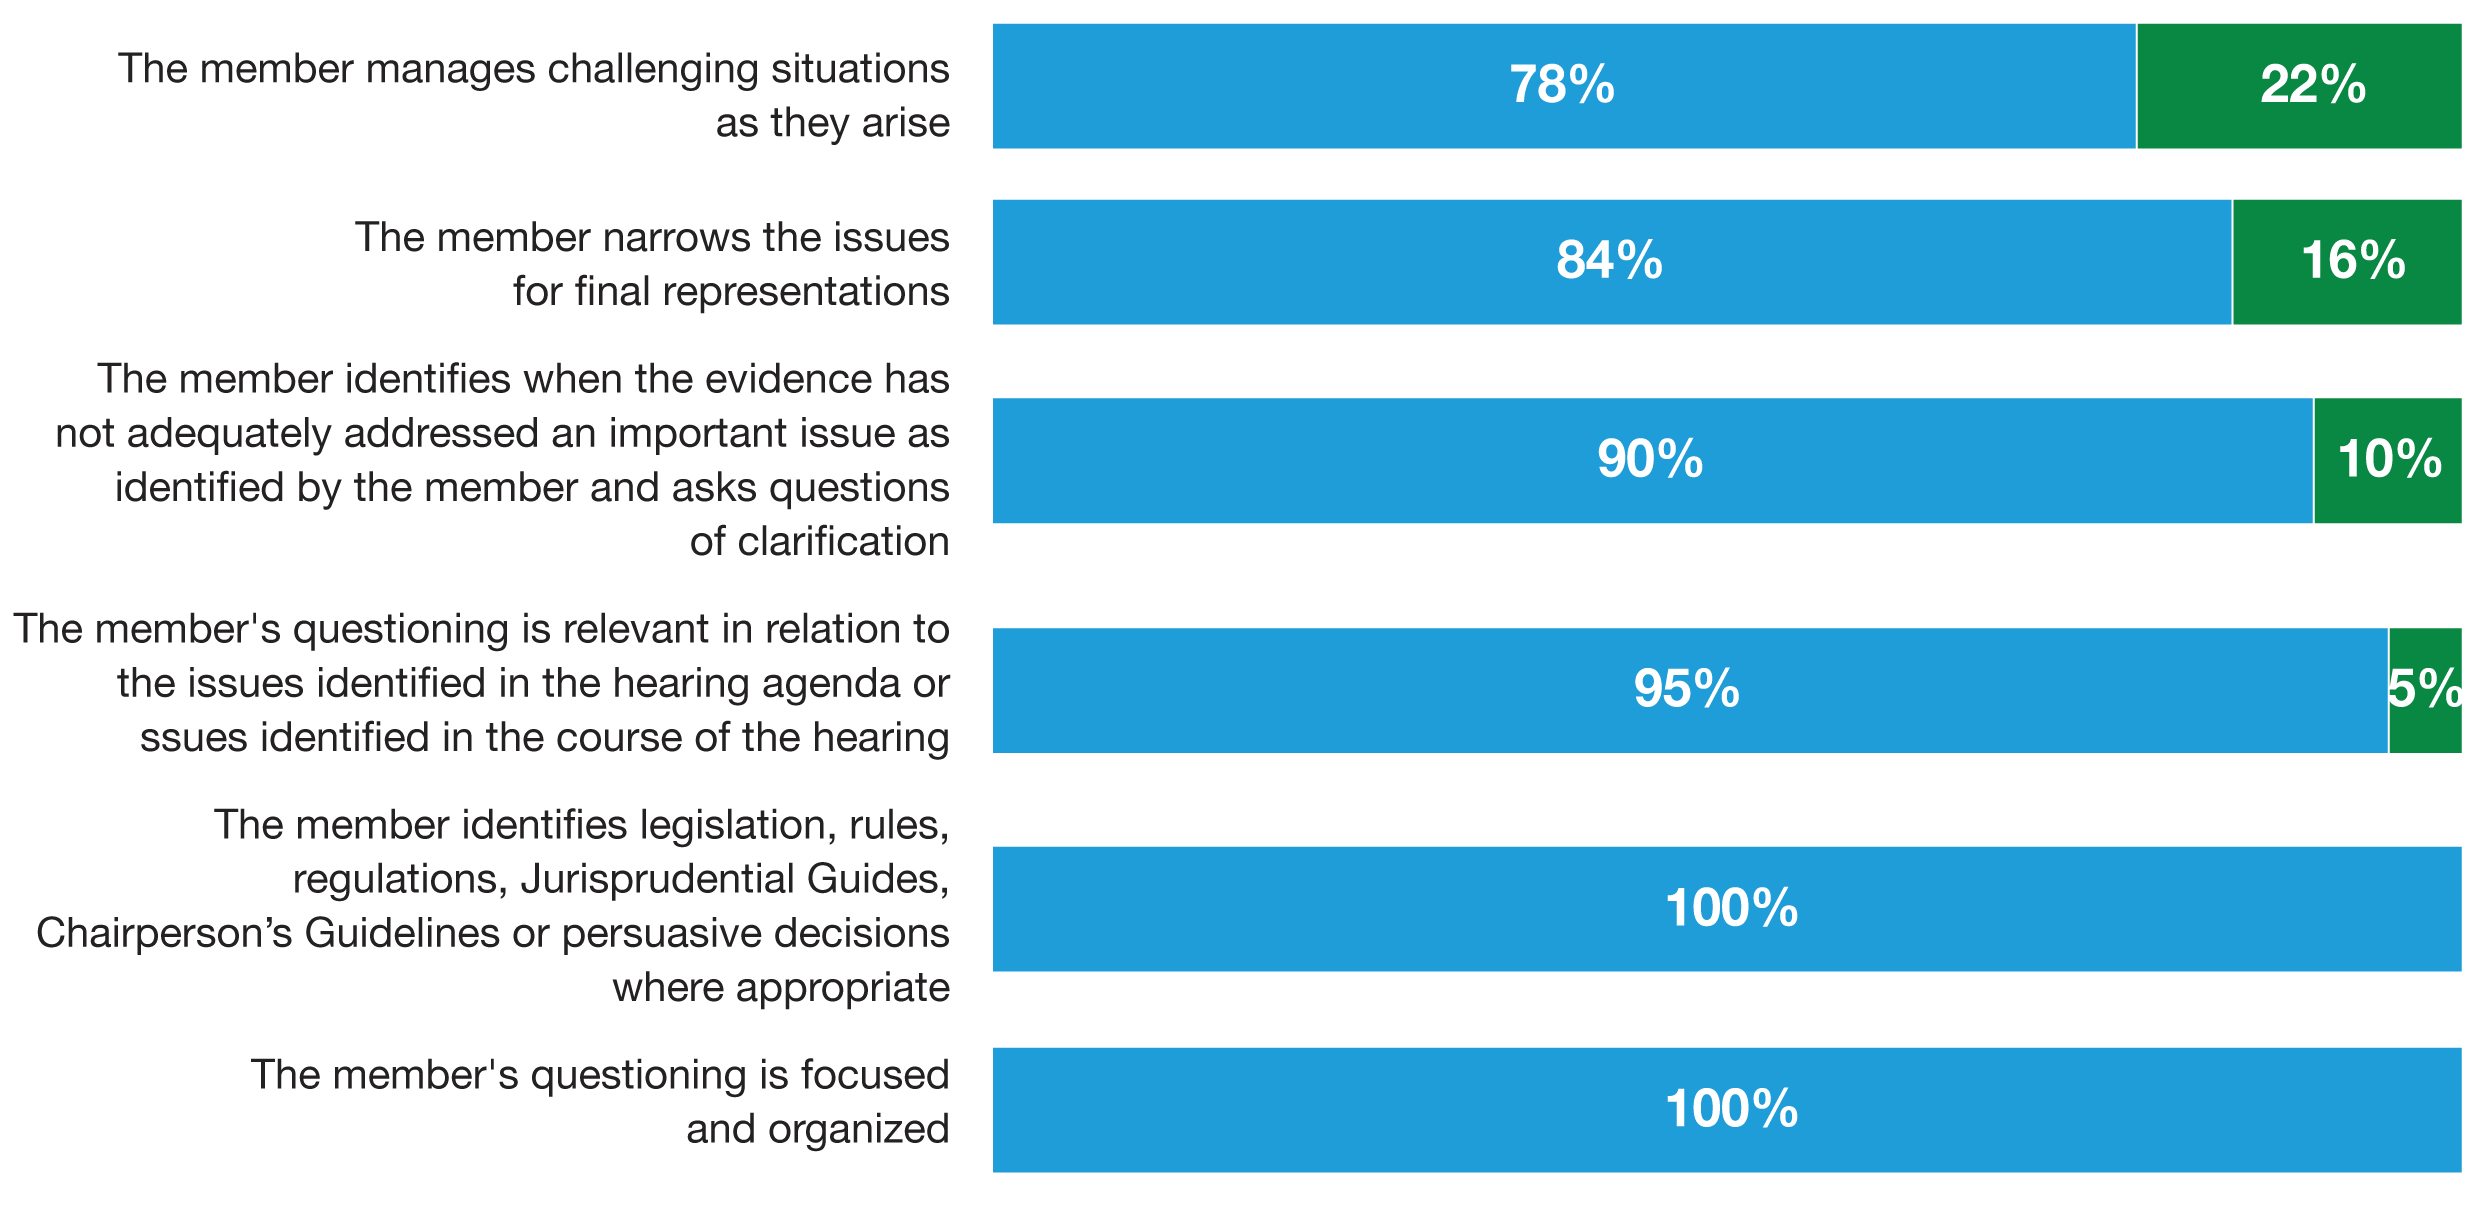
Top performing indicators
Text format – Top performing indicators
The member manages challenging situations as they arise
| 78% Meets expectations | 22% Exceeds expectations |
The member narrows the issues for final representations
| 84% Meets expectations | 16% Exceeds expectations |
The member identifies when the evidence has not adequately addressed an important issue as identified by the member and asks questions of clarification
| 90% Meets expectations | 10% Exceeds expectations |
The member's questioning is relevant in relation to the issues identified in the hearing agenda or issues identified in the course of the hearing
| 95% Meets expectations | 5% Exceeds expectations |
The member identifies legislation, rules, regulations, Jurisprudential Guides, Chairperson’s Guidelines or persuasive decisions where appropriate
| 100% Meets expectations |
The member's questioning is focused and organized
| 100% Meets expectations |
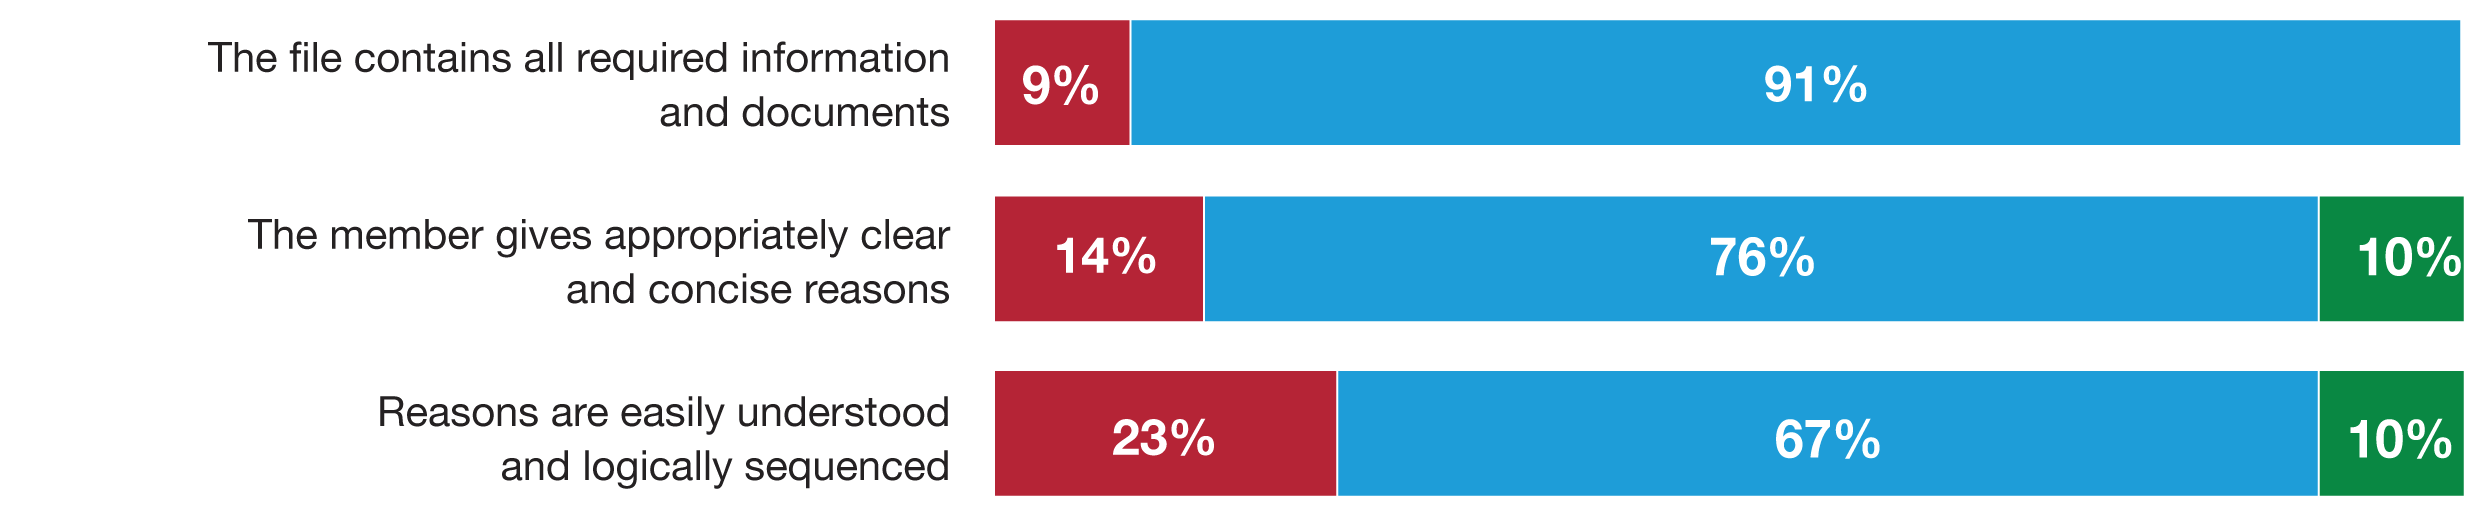
Lowest performing indicators
Text format – Lowest performing indicators
The file contains all required information and documents
| 9% Below expectations | 91% Meets expectations |
The member gives appropriately clear and concise reasons
| 14% Below expectations | 76% Meets expectations | 10% Exceeds expectations |
Reasons are easily understood and logically sequenced
| 23% Below expectations | 67% Meets expectations | 10% Exceeds expectations |
Considerations
The hearings in the sample were proportionally representative of the general population for region and language.
While the majority of the
IAD’s finalizations are reserved for written decisions, the sample focused on oral decisions. Residency obligation cases are over-represented in the sample as they have a higher rate of oral decisions. The next quality review will have a greater focus on written decisions.
For further information and a full report on data contained in this summary report please see:
Quality Performance in the Immigration Appeal Division 2021-22: Report of results.